Want to make sure your new hardware is installed and working properly? To eliminate hardware as the issue when a software update causes changes in behavior? A loopback test is a good place to start. This article will walk through the steps of setting up and running a simple loopback test you can recreate at your own work bench.
Developer Blog
How to perform a loopback test with CanKing 7
Required Components
- Kvaser drivers
-
- On Windows, use Kvaser Drivers for Windows
-
- On Linux, use Kvaser Linux Drivers and SDK
- CanKing 7
-
- On Windows, use Kvaser CanKing 7 for Windows x86-64
-
- On Linux Intel systems use Kvaser CanKing 7 for amd64
-
- On Linux ARM systems, use Kvaser CanKing 7 for Linux arm64
- Properly terminated CAN bus that has two DSUB 9 pin socket connectors
- Two CAN channels
The two CAN channels can be two Kvaser Leaf units connected to the same PC or a Kvaser USBcan Pro 2xHS v2. You want to have one channel that you know works and the second channel is the one you are trying to test. For this example, the devices used are a Kvaser Leaf v3 and a Kvaser U100 attached to the PC.
A properly terminated CAN bus has 120 Ohm resistor between CAN_H and CAN_L at both ends of the network backbone cable. If the CAN bus is extremely short (6 inches), you can get away with a single 60 Ohm resistor between CAN_H and CAN_L. For this example, the CAN bus is a Kvaser T-Cannector v2 with the resistor switch set to 60 Ohms.
Preparation
- Install the Kvaser drivers for your OS.
- Attach the Kvaser unit(s) you are going to use and ensure that you have a solid power LED on each unit.
- Install Kvaser CanKing 7.
Create Your Measurement Setup
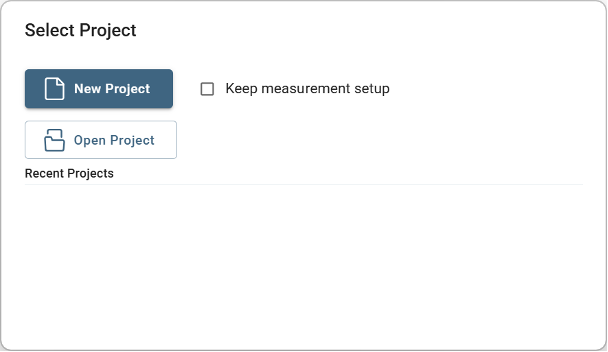
Launch Kvaser CanKing 7 and you will be presented with the New Project dialog. Uncheck the Keep measurement setup checkbox and then press the New Project button.
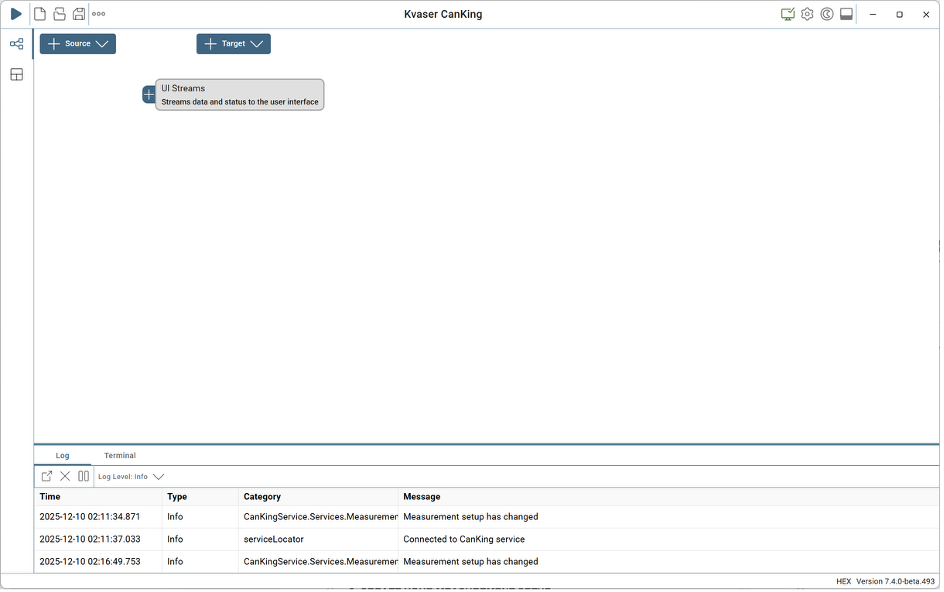
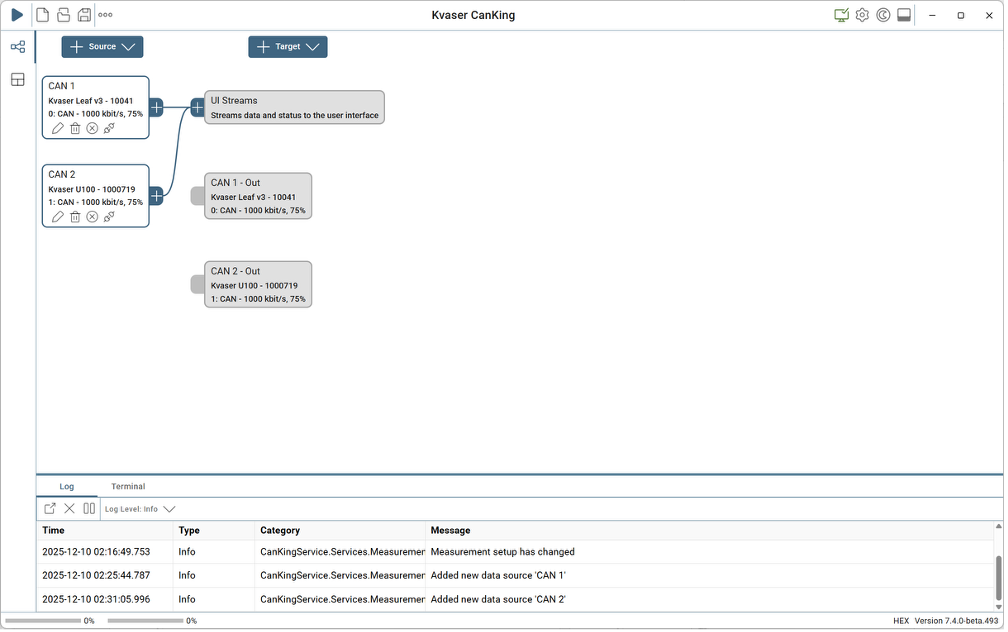
CanKing 7 will then present you with an empty project with the Measurement Setup view. Here we will configure the communication used.
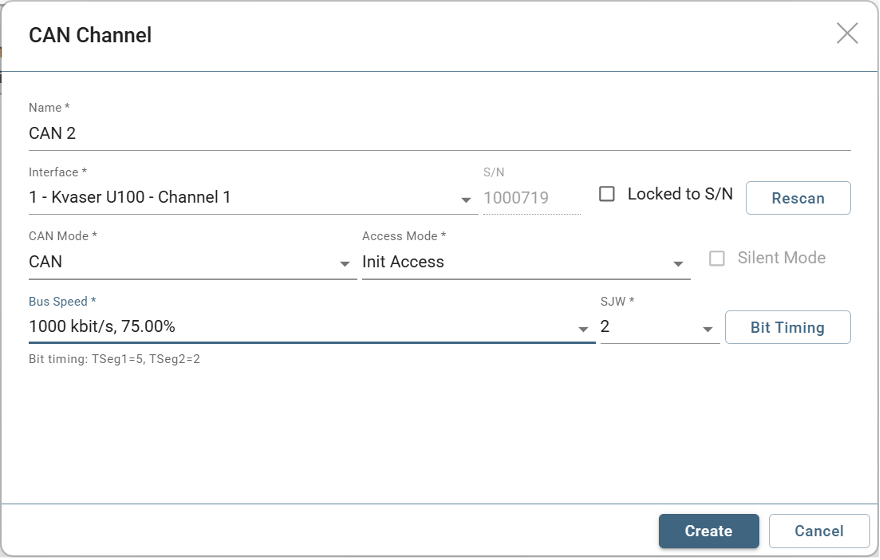
Press the Add Source dropdown and CAN channel to add a Kvaser CAN channel to the setup. You will be presented with the CAN Channel configuration dialog.
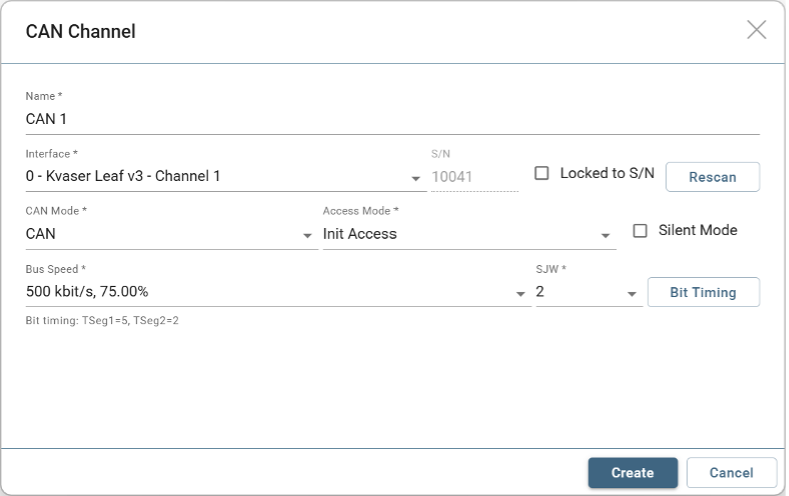
You can use this dialog to change which interface is used, control the interface mode, and configure the bit rate. For this demonstration, the Kvaser Leaf v3 is set to 1 Mbit/s from the Bus Speed dropdown. Once you press the Create button, the interface is added to the configuration and automatically attached to the UI stream.
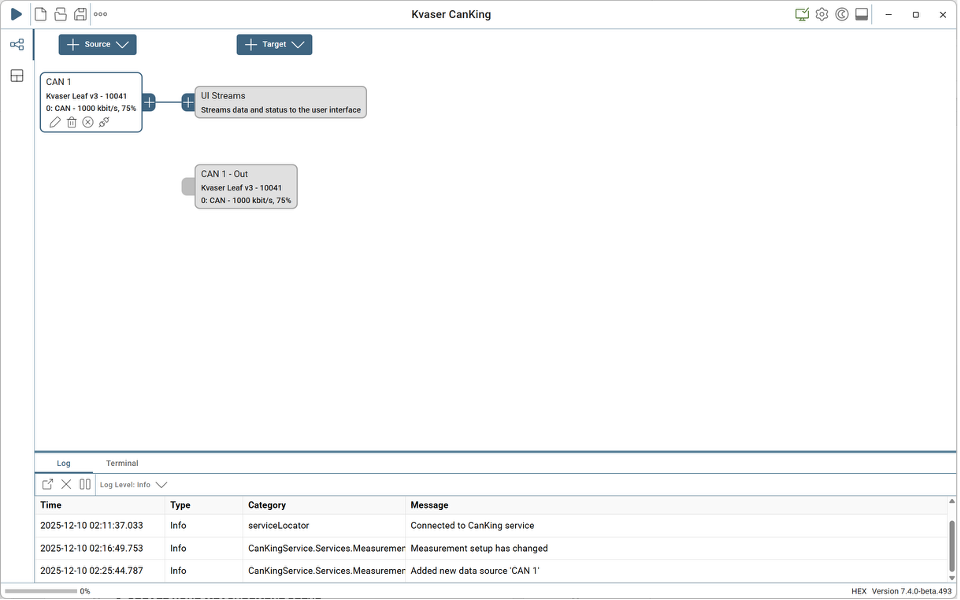
Repeating the same process, you add the second channel to be used making sure that you configure the channel for the same mode and bit rate. In this example, they will be a Kvaser U100 and a bit rate of 1 Mbit/s.
The Measurement Setup is now complete as shown in the figure.
Create Your Workspace
The Workspace allows you to visualize the CAN traffic using various views. To start, click on the Workspace icon on the left bar of CanKing 7. You will be presented with an empty Workspace.
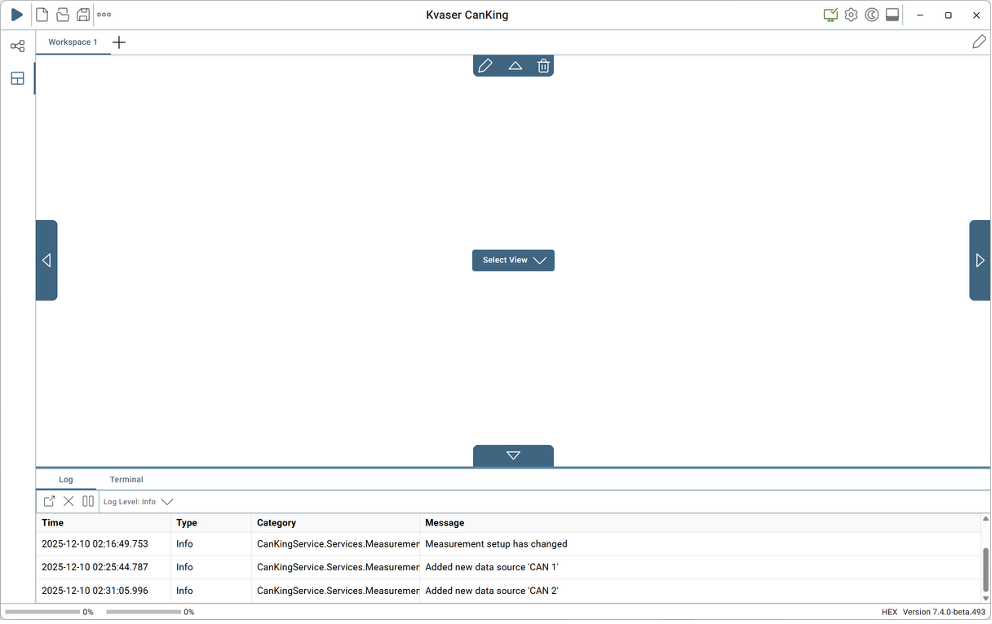
The arrows on each side of the Workspace are used to break the Workspace into multiple views. The Select View dropdown allows you to choose the type of view provided.
This demonstration has the Workspace divided into three views. Press the arrow on the left side of the Workspace to create a second view. Then press the down arrow in the left view to create a third view. You should have something that looks like this.
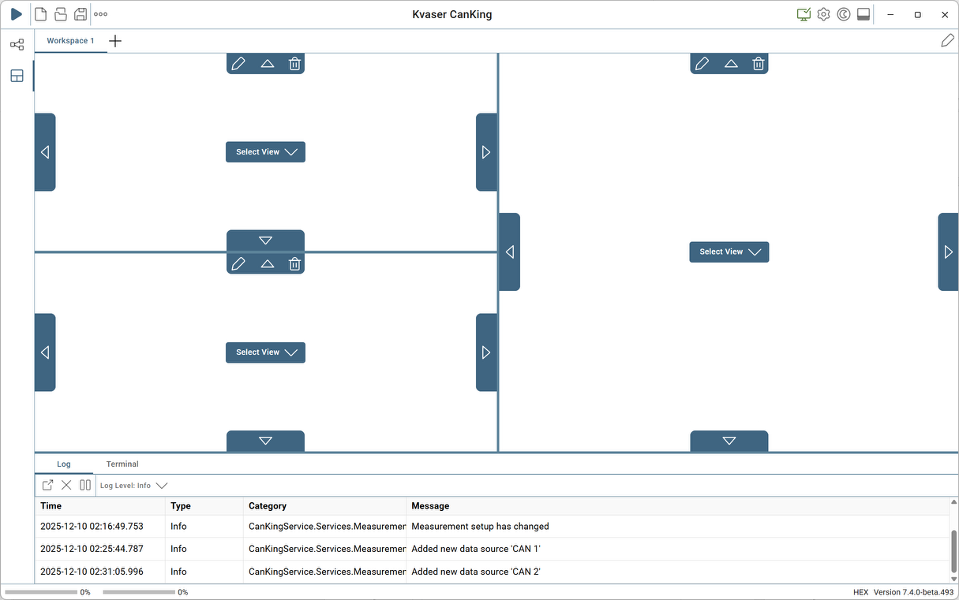
If you mess up, don’t worry. You can use the trashcan icon within the view to remove that view and then try again.
Now to select how to view the data. Press the Select View dropdown in the right most view and choose the Message Trace view.
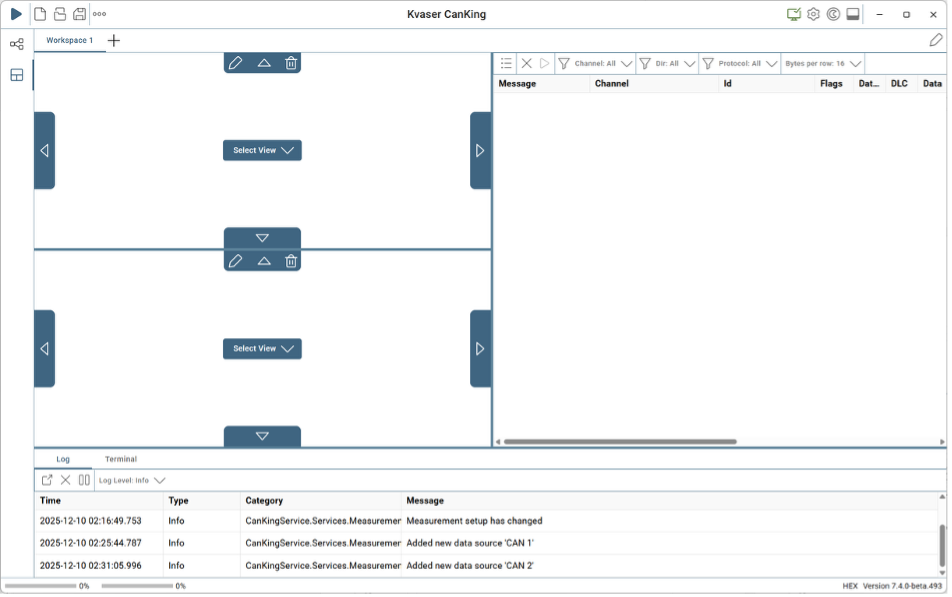
Using the top left view Select View dropdown, create a CAN Bus Statistics view. For the bottom left view, create a CAN Send view.
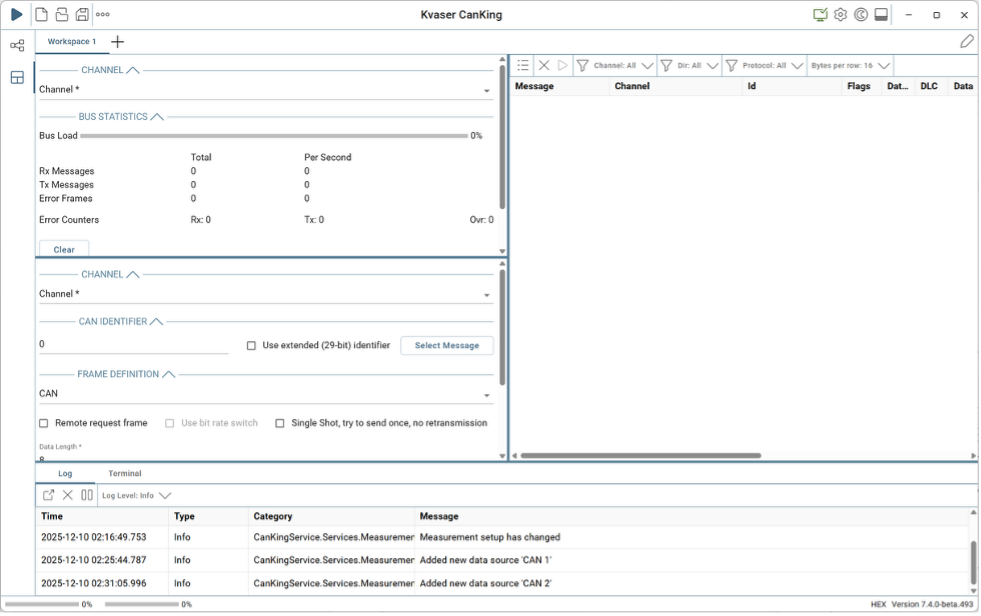
In the Bus Statistics view, set the channel to CAN1.
In the CAN Send view:
- set the channel to CAN1
- check the Use extended (29-bit) identifier checkbox
- set the identifier to a desired value in hexadecimal (for example: 18EAFF02)
- Press the Randomize Data button to fill in the data bytes
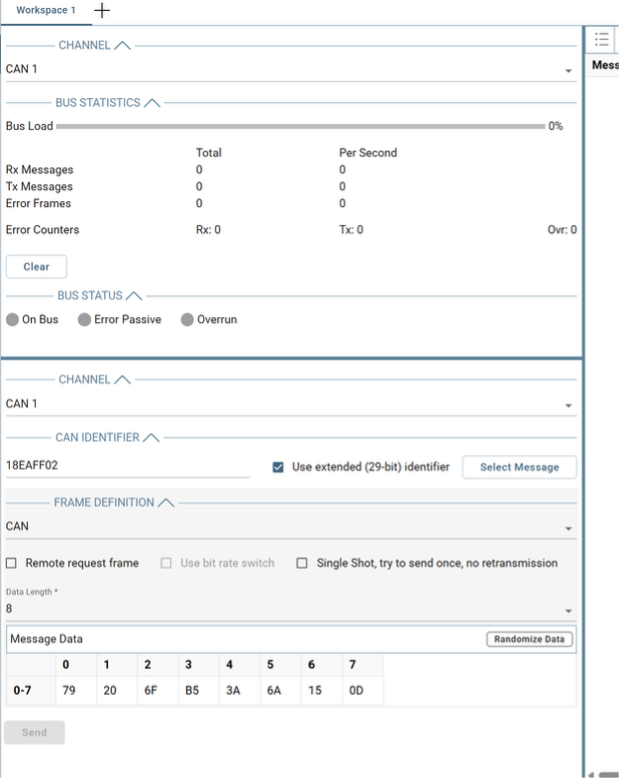
We now have a complete Workspace to monitor the CAN traffic between the two channels.
Testing
To start the measurement, press the Play icon in the top left of the CanKing 7 window.
Pressing the Send button in the CAN Send view will generate CAN traffic.
Based on the Measurement Setup created, any CAN frame transmitted or received on CAN1 or CAN2 will be sent to the UI stream. The UI stream is sent to each of the views in the Workspace.
So, the Message Trace view will show the CAN frames transmitted and received by both channels. The Bus Statistics view will show the number of messages transmitted and received on CAN1. The CAN Send view will generate the specified CAN message through CAN1 every time the Send button is pressed.
This means every time the Send button is pressed, there should be two entries in the Message Trace view–one being the transmit on CAN1, and the other being the reception on CAN2–and the TX Message Total in the Bus Statistics should increase by one. If there is anything else, there may be an issue. There should be no error frames in the Bus Statistics or Message Trace views. There should not be any errors reported in the Log pane at the bottom of the CanKing 7 application. It should look something like this:
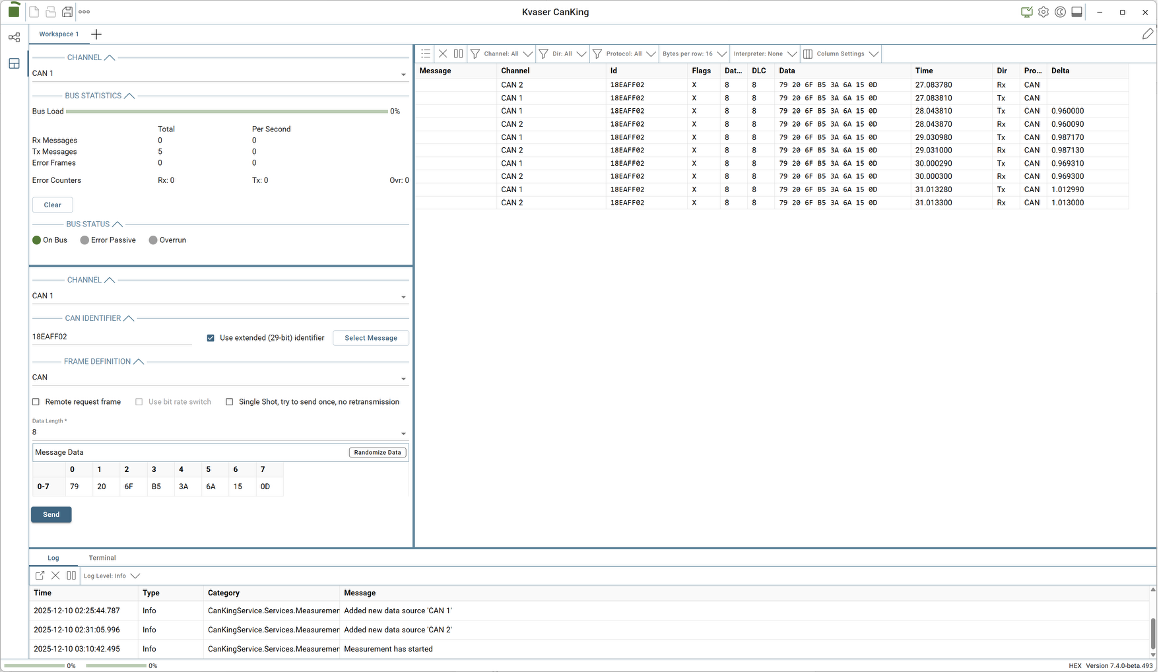
The Send button has been pressed 5 times to generate the traffic shown. Do not be concerned about the order transmitted frames and corresponding received frames are displayed in the Message Trace view. The order depends on which interrupt fires first and the interrupt priority in the associated hardware. As you can see in the figure above, the order has varied on one of the transmissions. This does not indicate any issues.
If CAN2 does not generate the appropriate ACK (acknowledgement) frames, has a damaged transceiver, or has shorted, you will see something like this after a single press of the Send button:
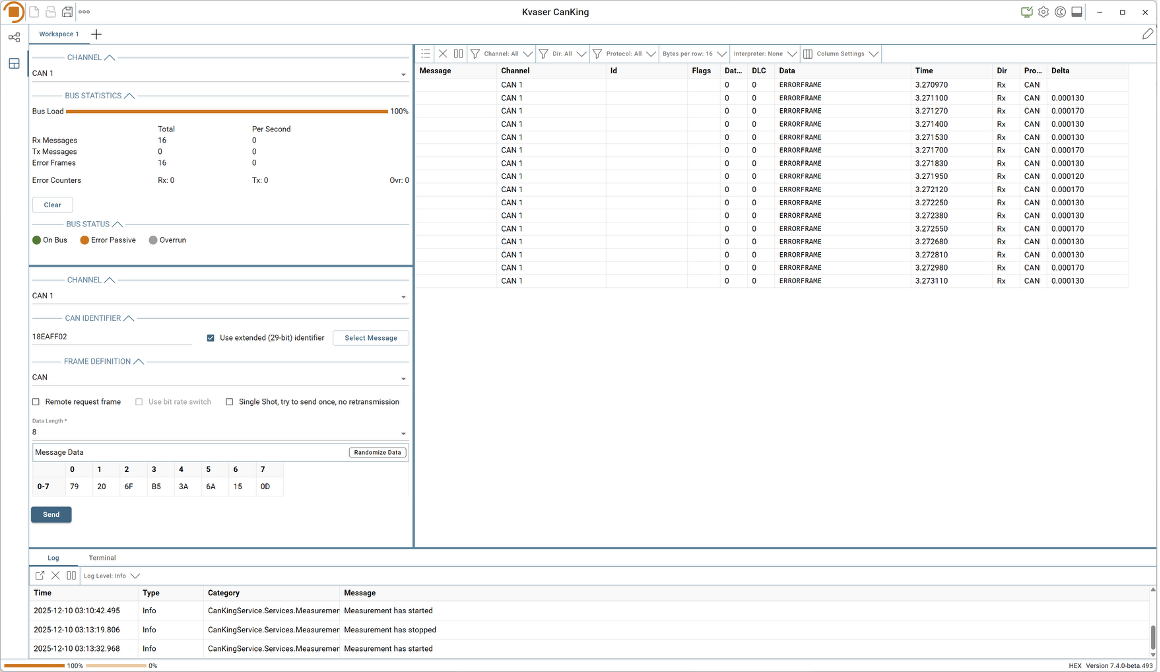
If you want to test traffic generated from CAN2, just change the channel in the CAN Send view.
If you think you have a broken cable coming in or out of the interface, you can change the CAN Send view to a CAN Periodic Send view:
- Press the pencil icon in the top right of the CanKing 7 window to modify the Workspace
- Press the pencil icon in the top of the CAN Send view and select CAN Periodic Send to change the view
- Press the pencil icon again in the top right of the CanKing 7 window to stop modifying the Workspace
Configure the CAN Periodic Send:
- Set the channel to CAN1
- Check the Use extended (29-bit) identifier checkbox
- Select the Random identifier radio button
- Check the Radom data length checkbox
- Check the Randomize message data checkbox
- Set the Constant interval to 200 ms
Press the Play button to start the test and then press the Start button in the CAN Periodic Send view. While monitoring the Message Trace view, flex and straighten the cables at both ends of the interface to see if you can cause Error frames to appear. If you can, most likely the cable entering the interface housing is damaged.
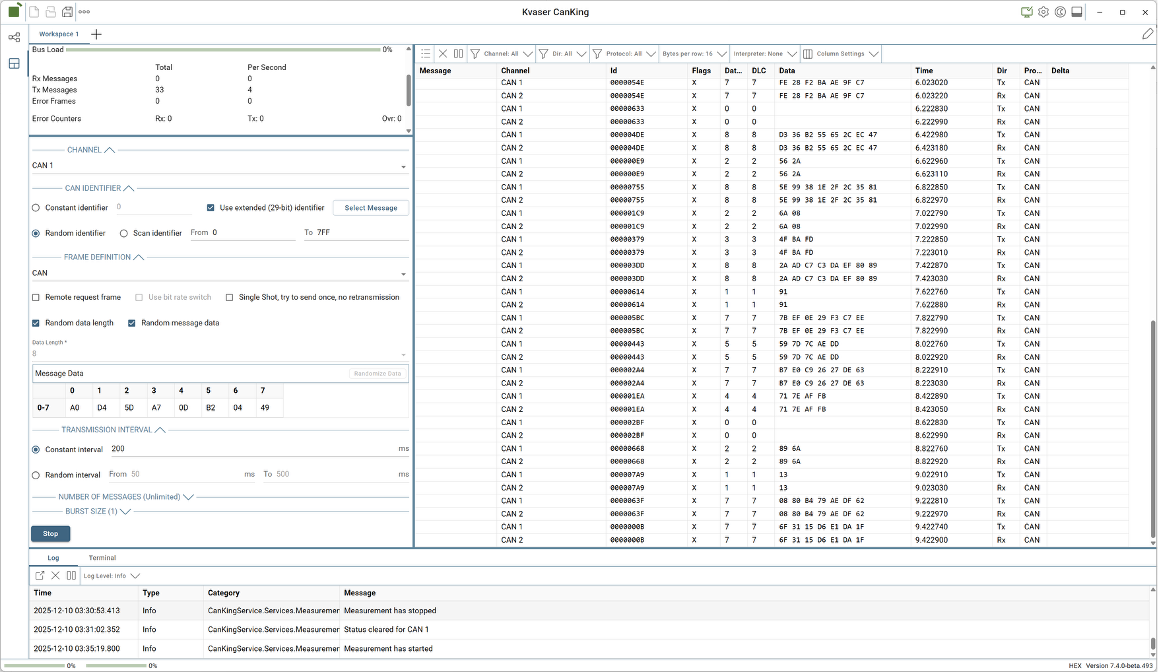
You can save any of your configurations to use again with the disk icon in the top left of the CanKing 7 window. When loading a configuration file, please remember to check that CAN channels in the Measurement Setup have identified the correct hardware. You may need to use the Rescan button inside the CAN Channel configuration dialog to choose the desired hardware.
Conclusion
The tests described in this document are basic tests to ensure the Kvaser hardware is working correctly. You can expand your testing with Kvaser CanKing 7 by exploring other features like the Log replay and Message logger.
If you have any questions, please visit our Support Page or contact [email protected].
